日本国产三级XXXXXX,亚洲人成网7777777国产,亚洲av无码专区色爱天堂老鸭,亚洲AV永久无码精品三区在线

CN
Home > Products > Fluorescence Spectrometer > OmniFluo-900 Steady-State & Time-Resolved Fluorescence Spectrometer

OmniFluo-900

OmniFluo-900 Steady-State & Time-Resolved Fluorescence Spectrometer

Inquiry
Download
Details
OmniFluo-900 Steady-State & Time-Resolved Fluorescence Spectrometer

Fluorescence Spectroscopy
Fluorescence is the light emitted by matter after absorbing light or other electromagnetic radiation. When light is irradiated to some atoms, the energy of light makes some electrons around the nucleus from the original energy level to a higher energy level, that is, from the ground state to the first excited single or second excited singlet states. The first excited single or second excited singlet states are unstable, so the ground state will be restored. When the electron is recovered from the first excited single state to the ground state, the energy will be released in the form of light, that is, to produce fluorescence.

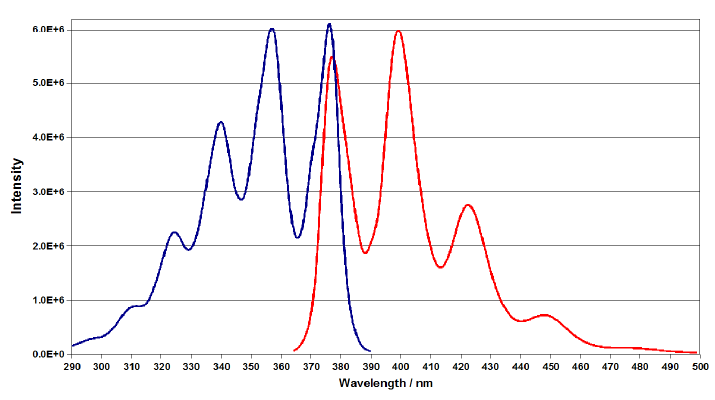
Excitation and emission spectra are standard measurements in fluorescence spectroscopy. In a typical fluorescence excitation spectrum measurement the excitation wavelength is varied across a region, while in a fluorescence emission spectrum measurement the excitation wavelength is fixed and measured by recording the emission spectra resulting from a range of excitation wavelengths and combining them all together. After correction, the relative intensity of fluorescence at different emission wavelengths was obtained.

Applications
Materials science (semiconductor materials PLE/PL)
•Reflection, Absorption and Quantum Yield Measurements of Phosphor Powders
•Fluorescence Upconversion
•Display technique, OLED
•Carbon nanotubes
•Biology (chlorophyll and carotenoid testing)
•Biomedical (fluorescence diagnosis of malignant disease)
•Environment monitoring

Fluorescence spectrum analysis
Fluorescence spectrum can provide more information, such as excitation spectrum, emission spectrum, quantum yield, fluorescence lifetime, fluorescence polarization and so on. At the same time, the excitation and emission peaks can be used for qualitative analysis, and the relationship between fluorescence intensity and concentration can be used for quantitative analysis. In addition, the microscope accessories can be used for microscopic analysis.
 
A fluorophore which is excited by a photon will drop to the ground state with a certain probability based on the decay rates through a number of different (radiative and/or nonradiative) decay pathways. Steady state fluorescence can provide an average signal, and fluorescence lifetime can provide information about excited state molecules.
 
The experimental results show that many molecules fluorescence information is lost in the time averaged process. The fluorescence lifetime is related to the polarity and viscosity conditions of the microenvironment. We can directly understand the changes in the system studied by fluorescence lifetime. Fluorescence occurs mostly in nanosecond, which is precisely the time scale of molecular motion.
 
Time-Resolved fluorescence measurement is widely used in fluorescence spectroscopy, including materials science, chemistry, biological research macromolecules and cell imaging. The following are briefly introduced:

1 The measurement and analysis of the fluorescence lifetime of the mixed system:
When the system contains a variety of fluorescent substances, the fluorescence emission spectra of each substance may be overlapped and interfered, and the accurate information of the system cannot be obtained by using the Steady-State fluorescence emission spectrum. By Time-Resolved fluorescence, the composition of fluorescent substances in the system can be resolved through the difference of fluorescence lifetime, thus providing valuable information.

2. The influence of the different batches components on the phosphors quality and monitoring.
Oxygen (nitrogen) phosphor powders have been paid much attention in the field of solid luminescence because of their high luminescence efficiency, effective excitation of visible light, high stability and friendly environment. Among them, rare earth doped phosphors have good application prospects because of their high luminous intensity, high quantum efficiency and excellent thermal stability.

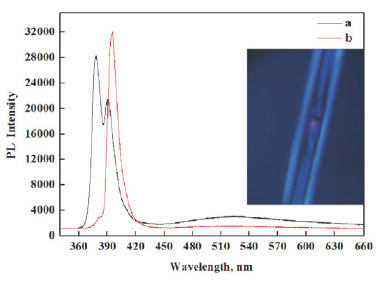
3. ZnO microtubules PL spectroscopy
ZnO is a kind of amphoteric white oxide. As shown, the wurtzite structure ZnO has central symmetry but no axial symmetry, and a dangling bond appears on the crystal surface due to the cross section. The influence of the characteristics of the surface section of ZnO crystal on the overall properties of the crystal increases with the decrease of its size, and even completely changes the original properties of the crystal itself. Therefore, by controlling the structure of Zinc Oxide, such as size, morphology or surface orientation, surface composition and surface charge, the properties of Zinc Oxide can be greatly adjusted or changed, so as to obtain the luminescence, fluorescence enhancement, ferromagnetism, catalytic properties and so on, in which the micrometer size of ZnO is luminescent.

PL spectroscopy is a non destructive and highly sensitive analytical method. It is a conventional test method in the development and production of semiconductor materials. It can detect the intrinsic luminescence of semiconductors and detect the defect luminescence caused by the conditions of doping, production technology and so on. The effects of optical properties provide theoretical guidance for semiconductor applications in photonic crystals, catalysis, sensing and dye-sensitized solar cells.

 
Fig.1 ZnO wurtzite structure Fig.2 ZnO microtubules
PL spectroscopy at different position,
the photo is the Microimaging
at the fracture of ZnO microtubule.
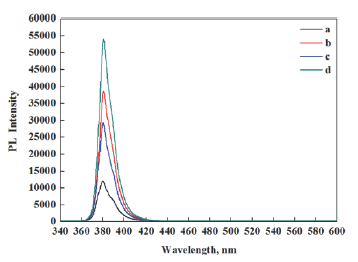
Fig.3 Different size of
ZnO microtubules PL spectroscopy


4、Upconversion Fluorescence Measurements
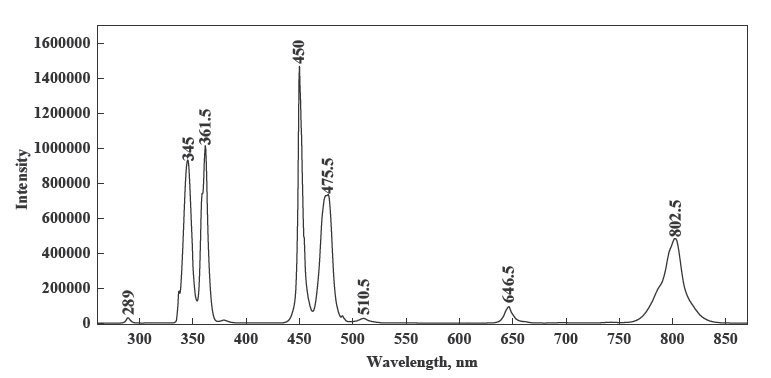
Fluorescence upconversion materials absorb light in the near infrared and produce emission of shorter wavelengths in the visible spectral range. Based on this characteristic, these upconversion materials are currently the focus of research for their use in biological fluorescence labeling, infrared photoelectric detection, and dye sensitized solar cells and so on. The excitation light of the rare earth doped upconversion nanomaterials is infrared light, and the light through the window of the biological tissue is in the infrared band, which means that the fluorescence probe can be realized in the body. In addition, the rare earth doped upconversion nanomaterials also have the advantages of high luminous sensitivity, stable chemical properties and low biotoxicity. Therefore, rare earth doped upconversion luminescent nanomaterials are expected to be ideal fluorescent probes for biological applications.


Fig. 4 NaYF4:Yb/Tm Upconversion Fluorescence Measurements


Time Resolved Fluorescence & Fluorescence Lifetime Measurements
The time resolved fluorescence mainly obtains the relaxation time of the sample from the excited state to the steady state by the pulse light source and the fast detector, which is the fluorescence life time. According to the different characteristics of the sample, its lifetime distribution can be from fs, ps, ns to ms. At the same time, for different samples, the test method will be different, the corresponding test methods are Fluorescence Upconversion, Time-Correlated Single Photon Counting, (Multiple Channel Scan etc.
 
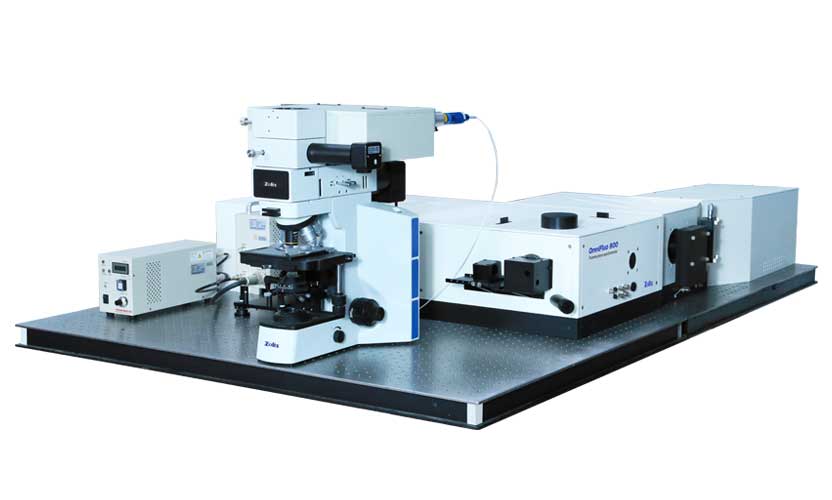
OmniFluo-900
Steady-State & Time-Resolved Fluorescence Spectrometer

OmniFluo Fluorescence Systems adopt modular design, which absorb Zolix fifteen years design and manufacture experience of spectroscopy system. The open architecture design also allows for application changes. As your application needs to grow, so can your OmniFluo. By different accessories, OmniFluo also could realize PL, Raman, transmission, reflection, absorption and detector calibration measurement. The possible configurations are endless.
 
OmniFluo Fluorescence Systems adopt high performance Omni-λmonochromator/spectrograph, high sensitivity single or multi-channel detector, single photon counting/lock-in amplifier technique. The standard for sensitivity is the signal-to-noise ratio calculated from a water Raman spectrum. Using this standardized test, our signal-to-noise ratio is 12000:1.
 
OmniFluo Fluorescence Systems can combine the PL and PLE in the same architecture. There are many configurations to fit your specific measurement, such as fluorescence spectroscopy, excitation spectroscopy, normal and low temperature testing.

Benefits
•Modular design, different function perfect combination to fit your specific needs
•Extended wavelength range with triple grating monochromators, 200 nm-2500 nm*
•Emission spectroscopy correction function*
•High output power, 75W Xenon light source
•Different Laser wavelength option*, 375 nm/405 nm/442 nm/532 nm/785 nm/1064 nm.
•Infrared test functions - Expansion option*
•Quantum Yield - Expansion option*
•Polarization fluorescence - Extension option*
•Fluorescence lifetime -- μs-s fluorescence lifetime measurement*
* Confirm the configurations according to the actual need.


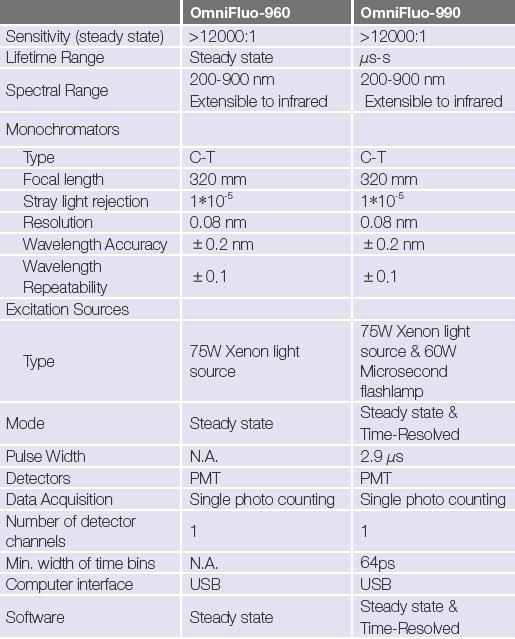
Specifications


Options